In the month of January 2021 we, at upGrad, looked at our website's page speed scores and accepted the fact that they demanded considerable improvement. Lighthouse is a popular and extremely useful tool to measure web performance, and well, the scores for upgrad.com were barely crossing two-digit values. The situation wasn't great, but personally it was exciting for me because it presented a live problem to be solved, and this post is about the journey through the rough seas of web performance.
tl;dr
We were successful in improving our website performance in terms of the Lighthouse scores going from about 5 and 15 to around 50 and 70 on mobile and desktop respectively.
I hope these numbers will encourage you to read the entire post, but I'll also try to make it interesting in general to read. See you until the end!
I consider this domain of web-development to carry a large importance for both - the developer working on the website/application, and the business/person owning the product. The situation's better when you play both of these roles, let's say when you launch your side project. Web performance is an area which is interesting to work on as a tech person, as well as has direct impact on the business side of things. If you've run your Lighthouse tests quite often (it is time to automate them), you might have seen these facts being shown.
Speed does matter. As users of the internet ourselves, we know how frustrating it is to wait for a page to load. I sometimes empathize web developers of certain websites if they load slowly, and wait for a few more seconds. Unfortunately, real world users won't do that. As everything is becoming more and more instant, giving the best experience on the web is one of the core responsibilities of a web developer.
The January of 2021 #
I do not want to sound poetic, but let's go back to the January of 2021. The growth team at upGrad had worked on a crucial project this month - the separation of authentication logic from the website, and integrating a mobile OTP-based login+signup flow. It was an interesting project and Akshay is soon coming up with an article about it. But given that, now the upgrad.com website consisted only of representational content. In an ideal world, the website could have been built with plain HTML & CSS, but having a framework like Nuxt.js gives us a lot of benefits in terms of operability and dynamism.
Anyway, the Lighthouse scores for the website were as follows (for desktop):
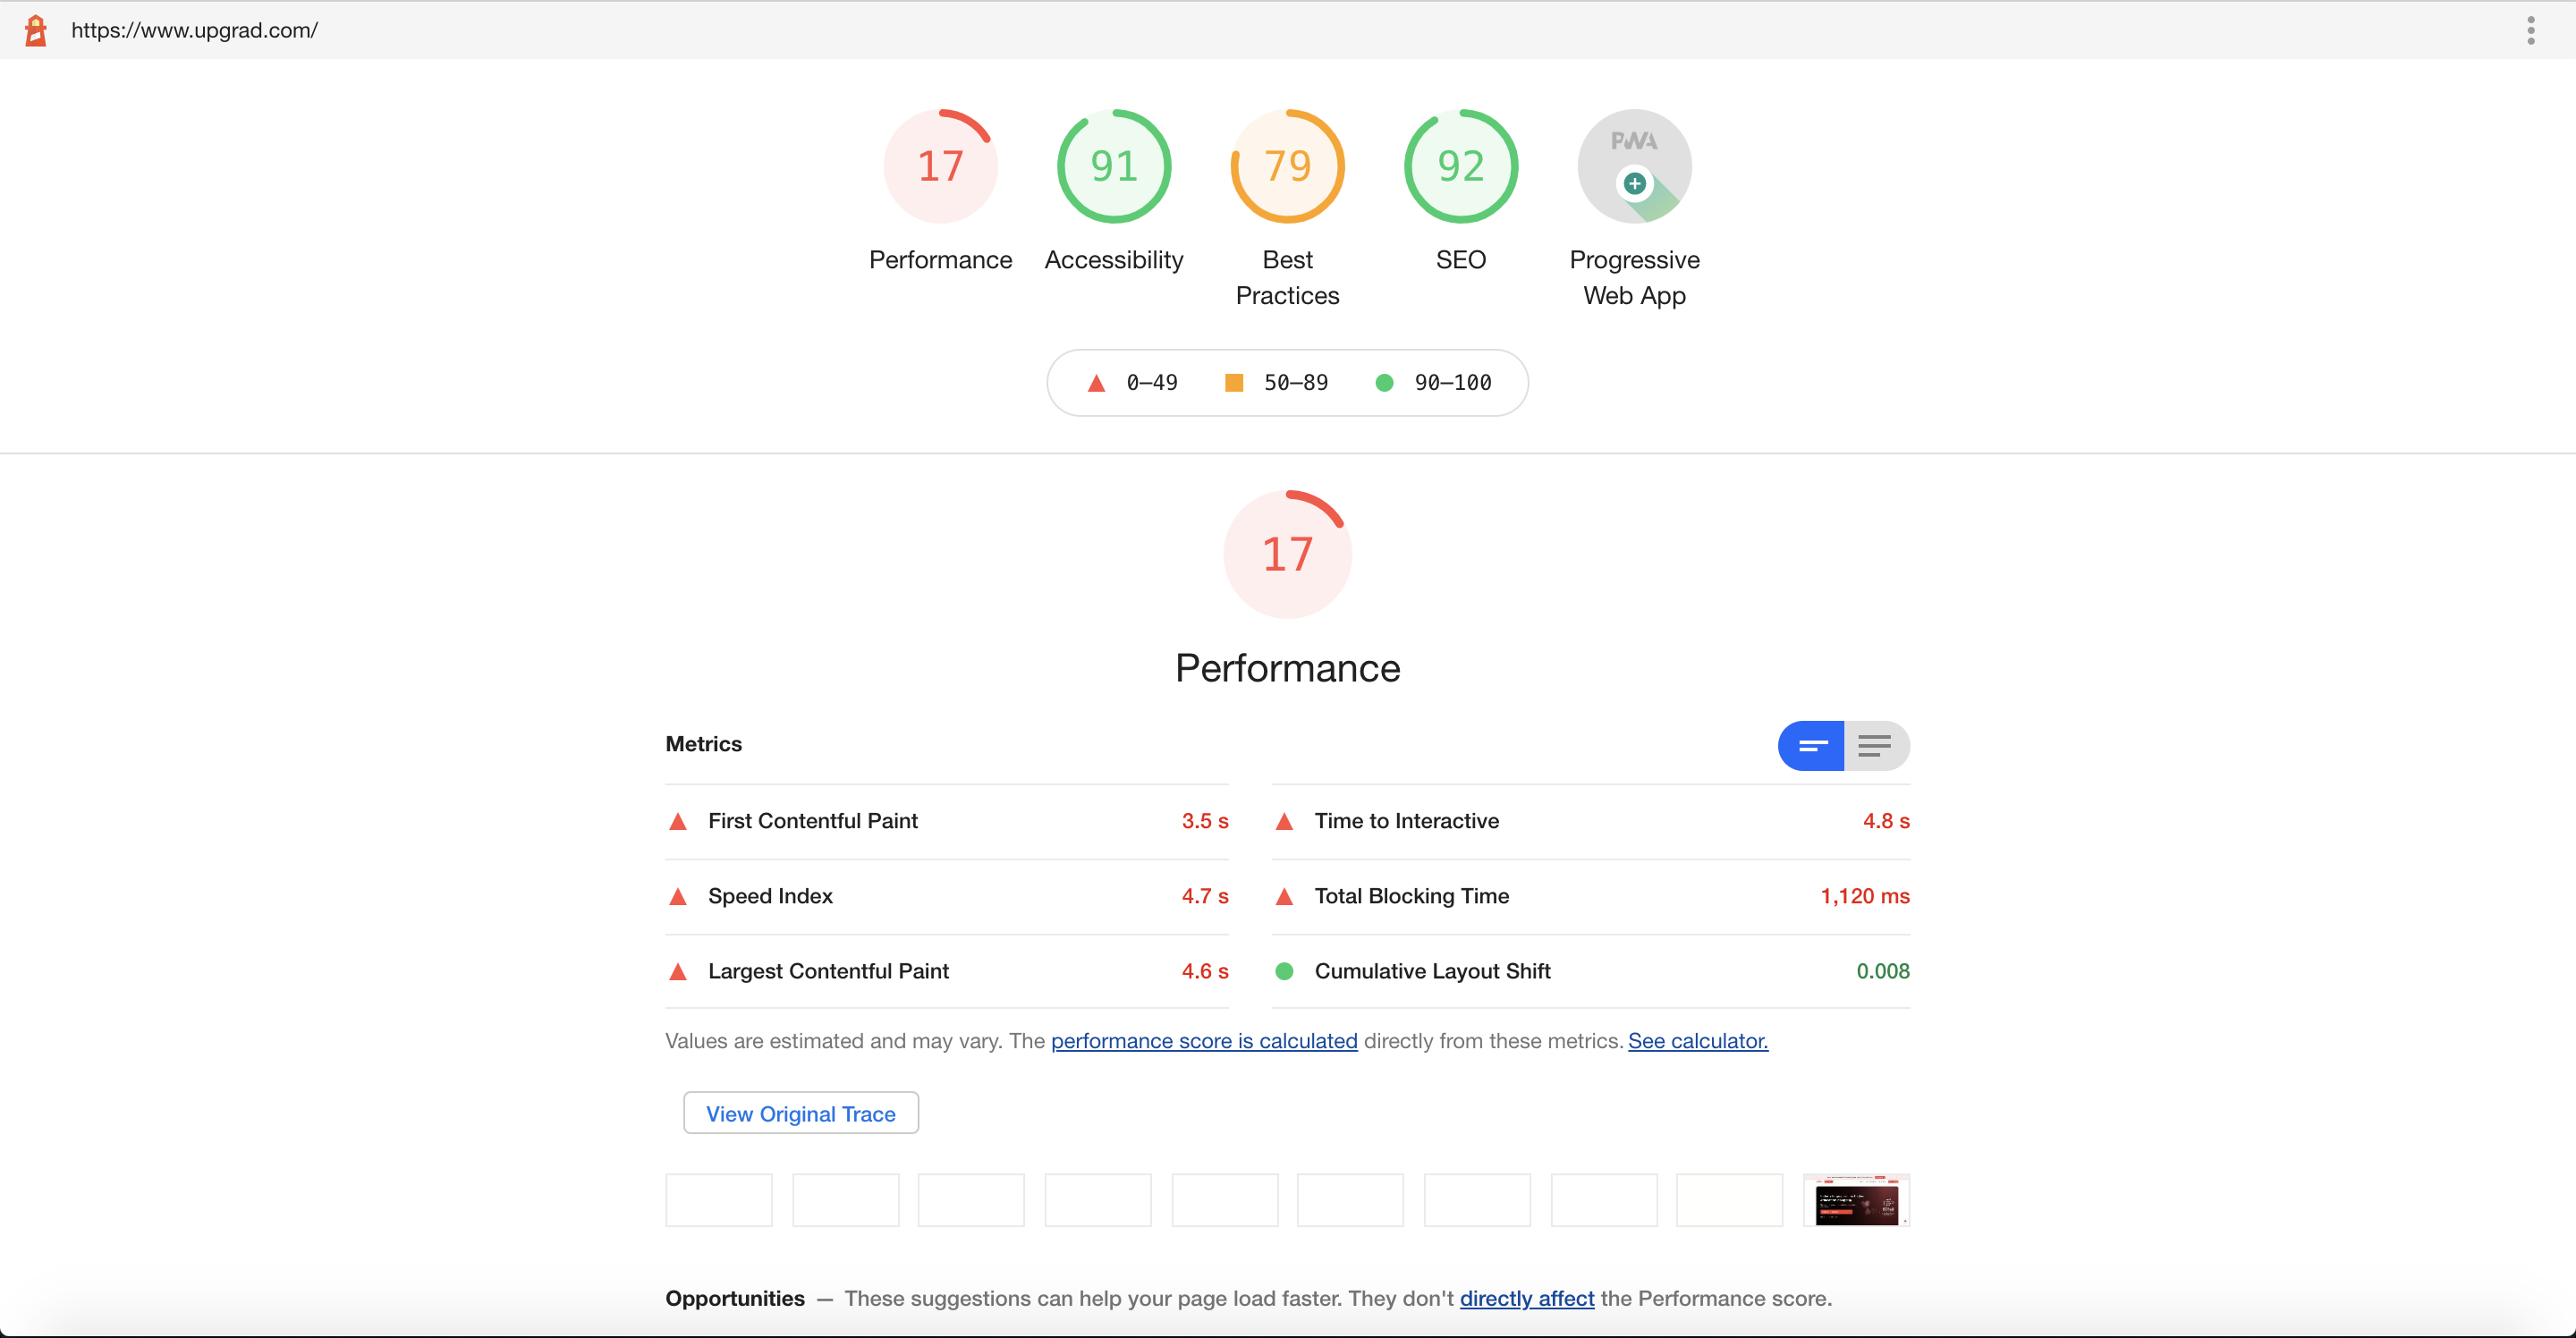
A 17 for desktop usually means your mobile scores sit somewhere lower, around 8-10. Things to note in the above screenshot are the values for the web vitals, most of them in red. Lighthouse considers these values to be important denoting factors about how your website loads and how it is perceived by the users. Let's take a short detour into how a browser loads a page, the web vitals then would be much clearer on the way.
Journey of a page #

A browser usually goes through the above flow whenever it receives its first chunk of HTML from the server. HTML is a special language, it is forgiving. And hence its parsing is special too. To go a bit into details, HTML does not have a Context-Free Grammar, as most of the languages would have. This grammar tells what is valid and what is invalid in a language. In HTML, the browser usually corrects if some parts are erroneous. In addition to this, HTML can change while parsing is still happening! JavaScript can inject HTML into the page using document.write() and because of this HTML parsing is called reentrant.
If we consider a short example page's HTML
Scenario 1 #
<html>
	<body>
		<h1>Hello</h1>
	</body>
</html>
Here, the parser will start from the top and go on identifying corresponding nodes. It will find open html -> open body -> open h1 -> text Hello -> close h1 -> close body -> close html. At the end of the parsing you'd generally have a syntax tree which will mirror a corresponding DOM tree. The object would be the one which will be exposed to JavaScript inside document.
Essentially, the DOM tree would be constructed, layouting would be done and then the bitmap would be painted on the screen. Super optimal.
Scenario 2 #
<html>
	<head>
		<link rel="stylesheet" href="/main.css" />
	</head>
	<body>
		<h1>Hello</h1>
	</body>
</html>
Let's consider this example which adds a remote CSS stylesheet to the page. Any form of CSS on the page is render-blocking. It means that until all the CSS isn't parsed, the renderer won't paint the page - remember from the above flow diagram that the render tree construction requires the CSS tree to be ready.
Hence in this example, the DOM tree would be constructed, but the rendering would not happen until the CSS file is loaded and parsed completely. A bit less optimal.
Scenario 3 #
<html>
	<head>
		<link rel="stylesheet" href="/main.css" />
		<script>
			console.log('Hello from JavaScript!');
		</script>
	</head>
	<body>
		<h1>Hello</h1>
	</body>
</html>
Let's add a <script> tag to the head. Any form of JavaScript on the page is usually parser-blocking. The HTML parsing is blocked until the script is executed - this is again because JS has the potential to modify the DOM, so the browser wouldn't want to proceed and later get to know that the code it had parsed was stale. You can think how this might get affected if you have remote JavaScript files, which is usually the case. The files would first have to be downloaded and then executed for the parser to move ahead. Very un-optimal.
Mozilla Developer Network documentation as well as Google's web.dev articles explain this in great detail. You might want to look into those.
The crux of the detour above was to discuss what could potentially hinder our website from being loaded/visible to the users. From the discussion we can take two key points:
- CSS is render-blocking
- JavaScript is parser-blocking
These two points form a base to a large number of optimizations that one can perform to speed up their website. The core web vitals also get affected due to these.
Sourced directly from https://web.dev:
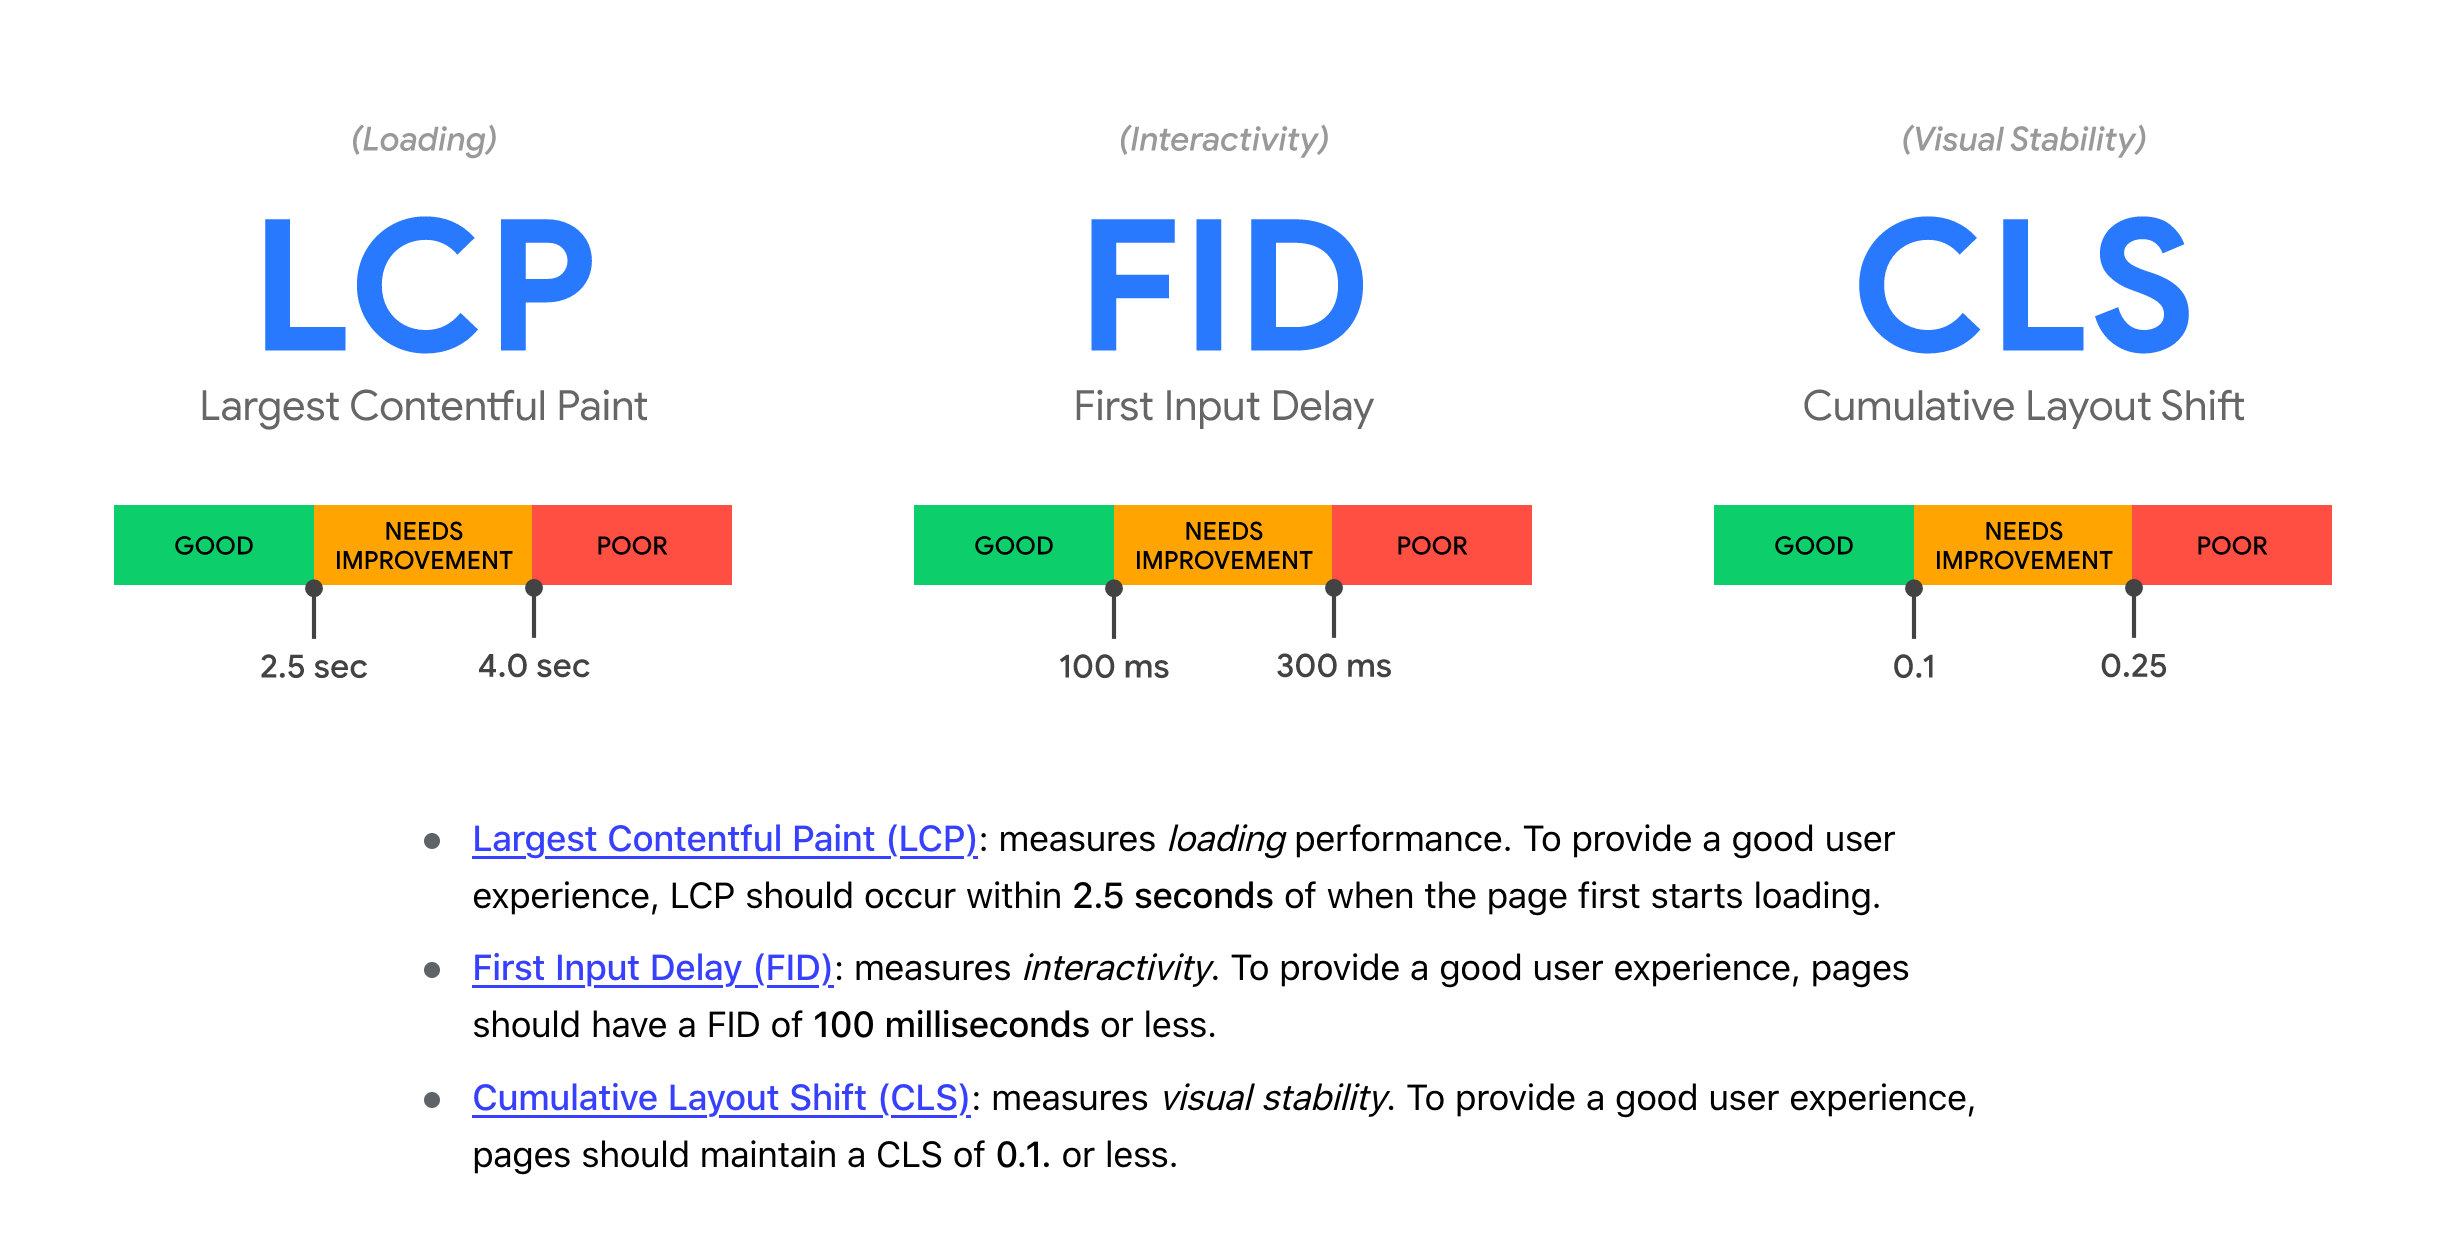
Anything render-blocking will worsen LCP. Anything process heavy on page load will worsen FID, e.g. synchronous JavaScript execution on main thread. Anything writing to the document and hence drastically changing the page layout will worsen CLS.
For the initial phases our target was reducing LCP.
Additional reading:
Identifying Areas of Improvement & Budgets #
To tackle the problem of performance, usually one can look internally first (quite philosophical). Before performing a complex change in your system, one must try to find areas to improve in the existing setup. It is quite probable that there would be a lot to clean up and optimize. At least that was the case with us.
But before beginning any work, how would you know what to pick and how that change would impact the performance? Enter performance analysis tools. There are numerous tools available online that help you know exactly where the bottleneck is. Lighthouse is one of such tools but I believe it should be used to benchmark the final score. There is another online tool called WebPageTest that gives you detailed report of your website's performance under various scenarios. I personally found is very useful to identify individual problems.
Following is a screenshot from webpagetest.org:
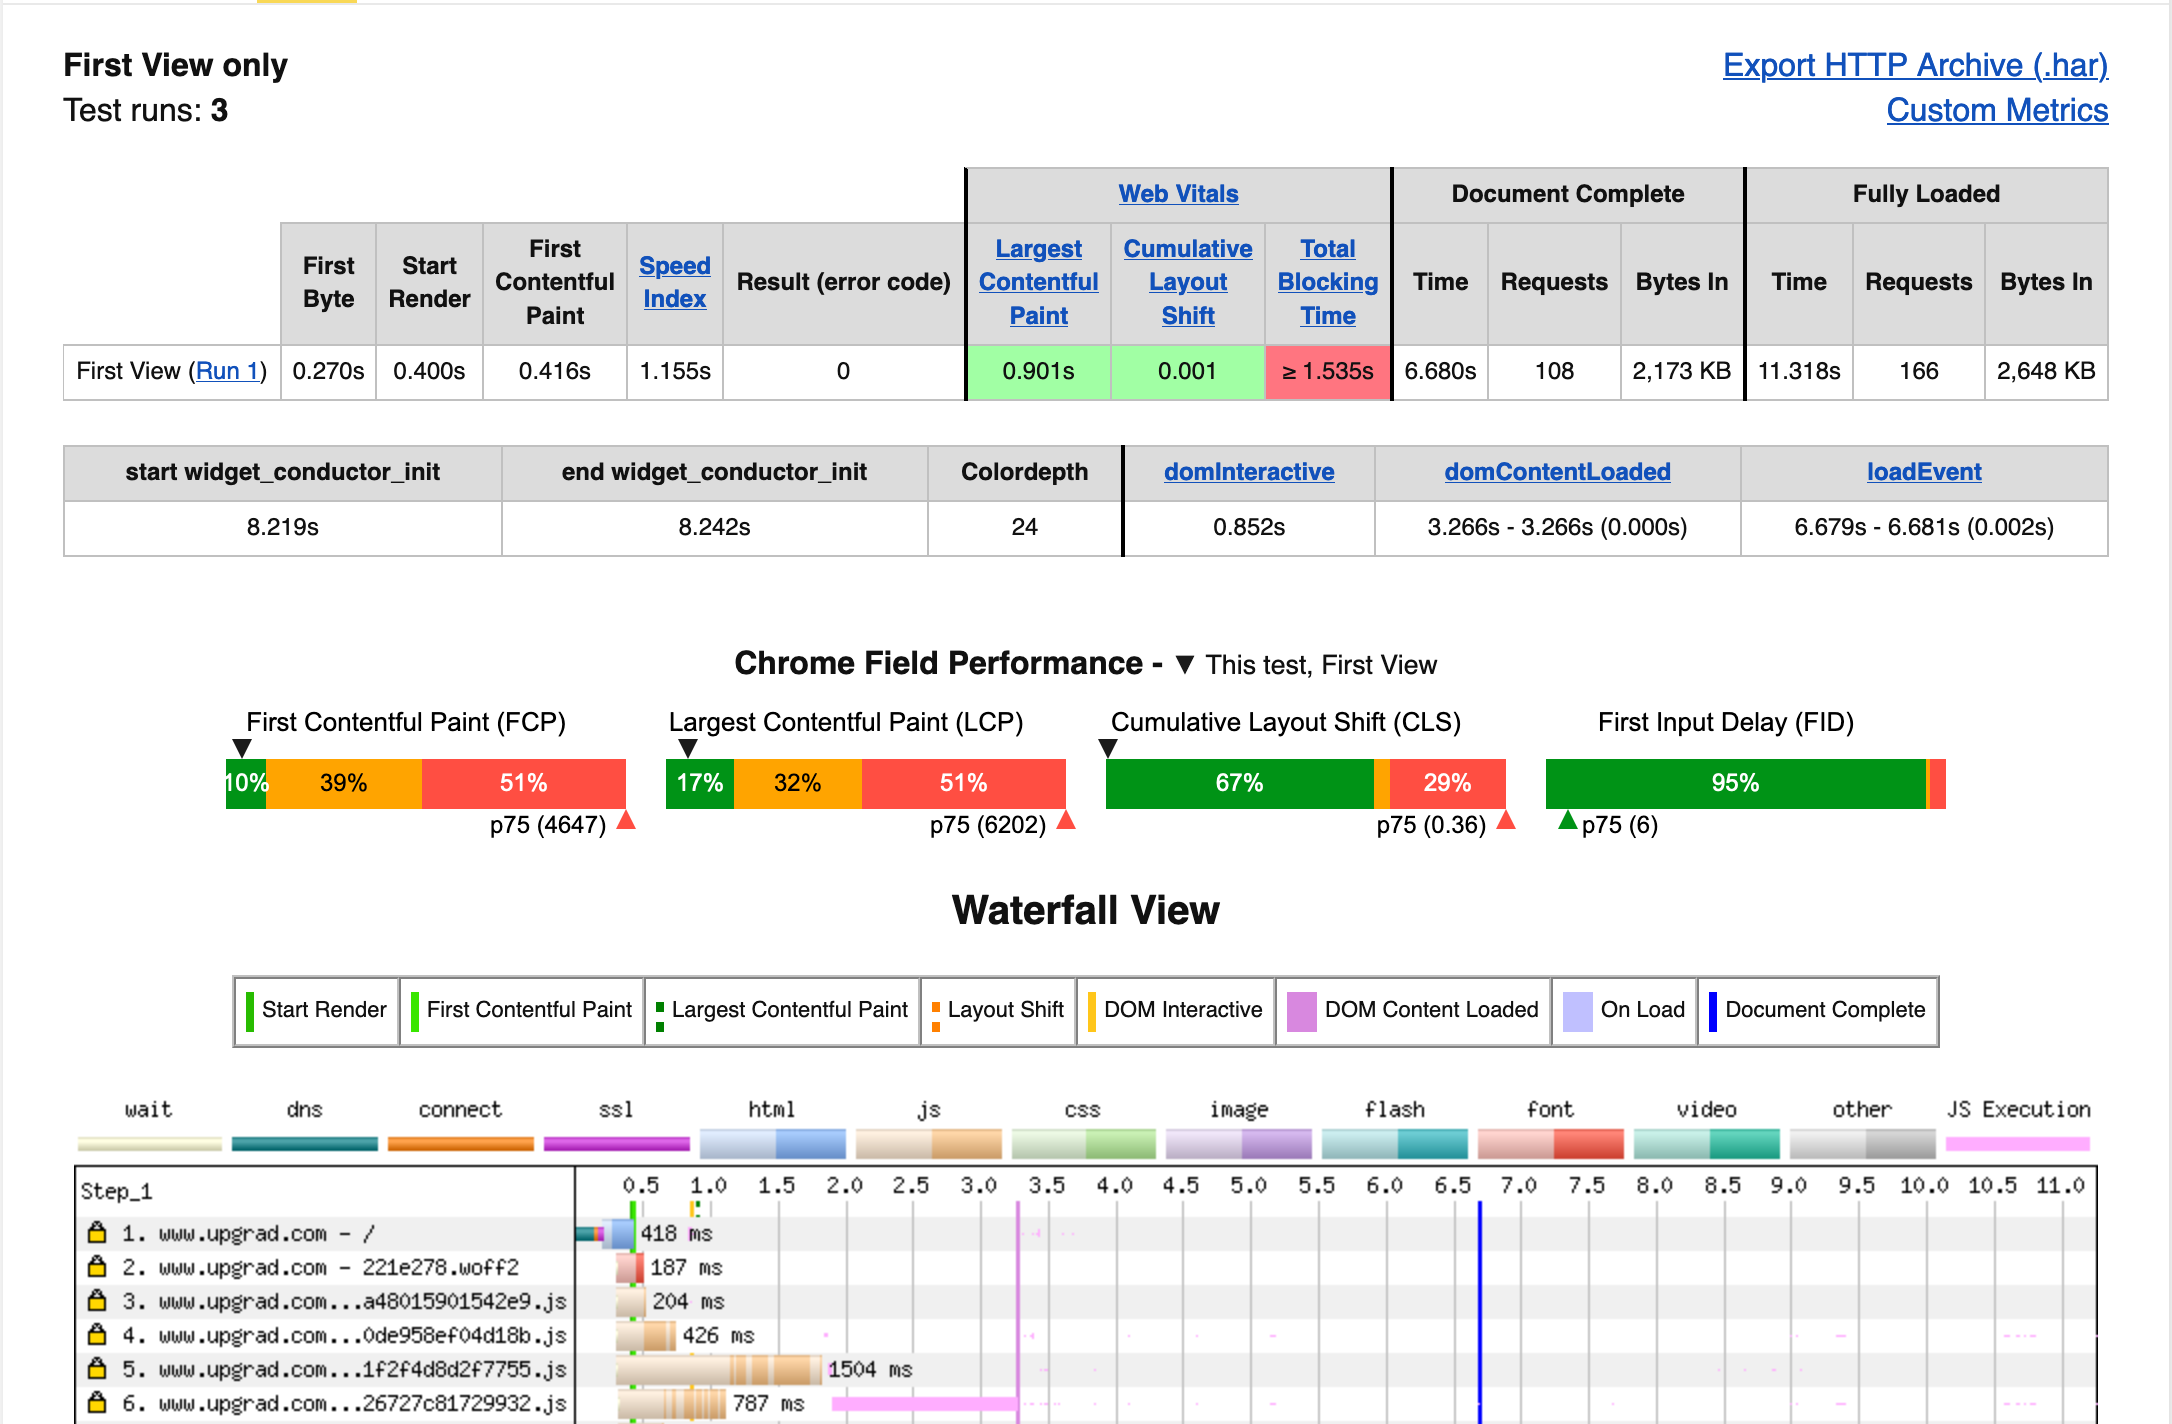
The above report gives a detailed view of what is happening on the page - from the vitals to the waterfall view and the vitals marked on it. It was particularly helpful to map what was delaying certain metrics and then target those resources specifically.
Budgeting #
This is a debatable topic but everyone can have their own preferred ways of budgeting your optimizations. This helps us maintain a threshold for either metrics or the experience that we want to provide to our users. I'll keep this section short and link to useful resources online:
- https://web.dev/defining-core-web-vitals-thresholds/
- https://csswizardry.com/2020/01/performance-budgets-pragmatically/
We began with some obvious areas that we could target - something that we knew already but could not find time to fix. These included some unused scripts and some modules that were being loaded globally when we could load them locally. In Nuxt, you can define global plugins that get included in the main bundle - often a bad practice if not monitored properly. So in short, here are a few key areas that can be targeted:
Defer Everything Unnecessary #
Impact - Time To Interactive (TTI)
You must defer/lazily-load everything that is not crucial for your first load and does not contribute to SEO. This includes modals, non-critical scripts, images, stylesheets and chunks of your applications.
For our website, we saw a considerable difference when we lazy-loaded all our modal content. Since it was a separated module in itself, we could do this easily. Most of the frameworks have special syntax for lazy-loading components, e.g. React.lazy() in React and the import() syntax in Vue. Bundlers provide automatic code-splitting based on this syntax so that your chunks are separate and are only loaded when requested for.
Since Nuxt uses webpack, we could use webpack's magic comments that allow you to define loading behaviours on chunks. /* webpackPrefetch: true */ is one such useful comment that prefetches the chunk so that the experience is similar to loading it synchronously.
Image lazy-loading is core to faster websites and usually is already implemented. But if it isn't then you should do it right away. There are popular libraries that allow this and now there's also a native way of doing it in HTML, though it isn't supported in all browsers.
The standard way of telling the browsers to defer loading a script, or load them asynchronously is by using the defer and async keywords correctly. defer moves the processing of a script to the end of parsing step. The script is fetched in the background and in parallel if many. This solves the issue mentioned in 'Scenario 3' above. That is also why usually it is recommended to keep your script tags at the end of the body. This helps in two ways - it allows the script to 'see' the entire body of the page at it was built before the parser reached the script tag, and second that the parses did not get blocked on the script somewhere at the beginning of the page.
async helps in a similar way but instead of loading the scripts in the end, they are loaded and even processed asynchronously. These won't wait for the DOM tree being built, but get executed as soon as they complete loading. A key difference between async and defer is that all scripts loaded with defer will block the DOMContentLoaded event while those loaded with async would not.
Another useful thing that can be leveraged off of frameworks is the dynamic loading of scripts. Keeping the core idea in mind - load only those resources that are required to build the page - we can dynamically push <script> tags in our website's head. This allows, e.g. loading the YouTube player script only on pages that actually display a video, ensuring that does not slow down a page that does not have a video at all.
Limit Critical Resources - Shorten the Critical Rendering Path #
Impact - First Contentful Paint (FCP), Largest Contentful Paint (LCP)
Critical rendering path (CRP) is the journey of a page being rendered in a browser from the point when the browser receives the first bytes of the response (HTML) to when the page starts becoming visible. Our aim should be to keep this as short as possible. As resources get added to this path, the time to start painting goes on increasing, hampering the page load experience.
CRP depends on the way your HTML document is parsed. If it is only static HTML, you would have a great LCP score. But practically, there are a lot of resources that usually get added on a HTML page, that are at times crucial for the website to behave properly. If these resources are required for your page to render, then they contribute to CRP. The parser has to do the work of loading and executing them and then continue to parse the page and then finally the renderer to take over.
Good resources:
For us, it was about looking at the waterfall snapshot from webpagetest and see what was delaying the first render. Upon checking, we could find that a particular CSS file was being loaded critically and to worsen the problem, it wasn't being served via a CDN.
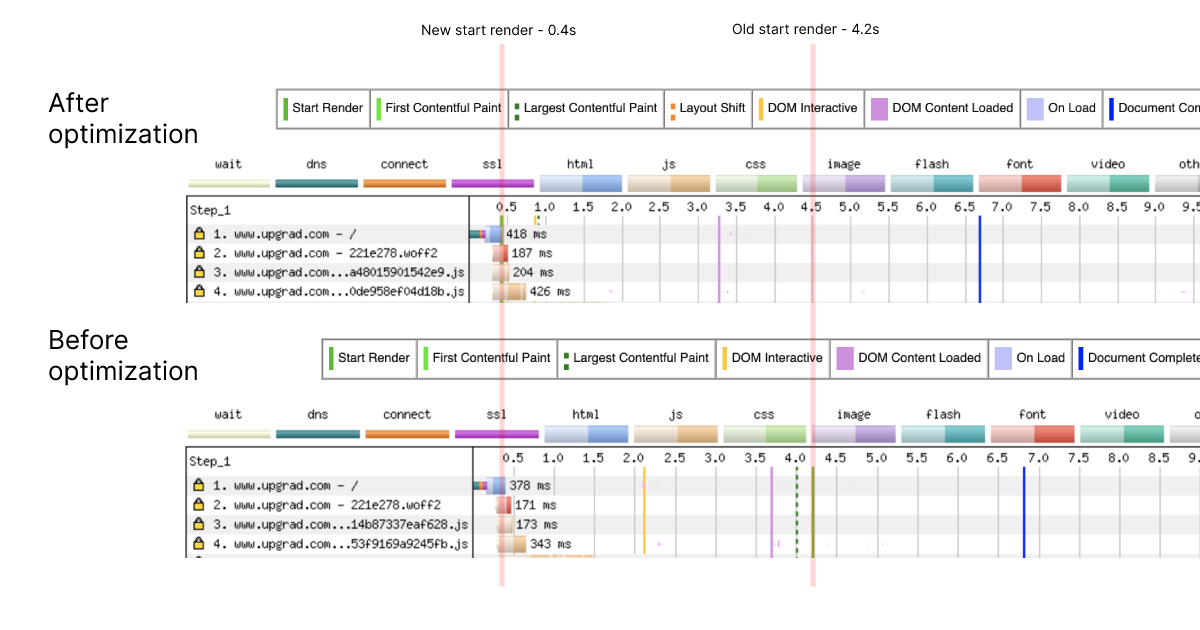
Finding such resources and unblocking them helped us improve our start render times by a good number - old one being at 4.2 seconds, improved to 0.4 seconds.
The initial HTML response of your page must contain only the critical CSS - CSS required for your page to be properly styled. All others can be lazily loaded. One popular way to asynchronously load CSS is using the media attribute of link tag.
<link
	rel="stylesheet"
	href="/link/to/file.css"
	media="print"
	onload='this.media="all",this.onload=null'
/>
Here, since the media value is 'print', the HTML parser in a browser would skip waiting on this stylesheet and move ahead. The stylesheet will still load in the background, and whenever it does, it will get parsed. This prevents blocking of the parser at the CSS link tag and is good for stylesheets that aren't required at the time of first load.
Even with the above solution, we must ensure that the critical CSS is lean. Tools like PurgeCSS help in automating this by cleaning out the styles that are unused on the page by going over the HTML of the finally generated page.
Preloading Critical Assets #
One other important practice is to preload all your critical resources. If your website has an image in the first fold, you must preload it so that it is visually available as soon as possible.
One can use the preload keyword to do this and many bundlers do this automatically for you.
<link rel="preload" as="image" href="banner-image.webp" />More on preload here:
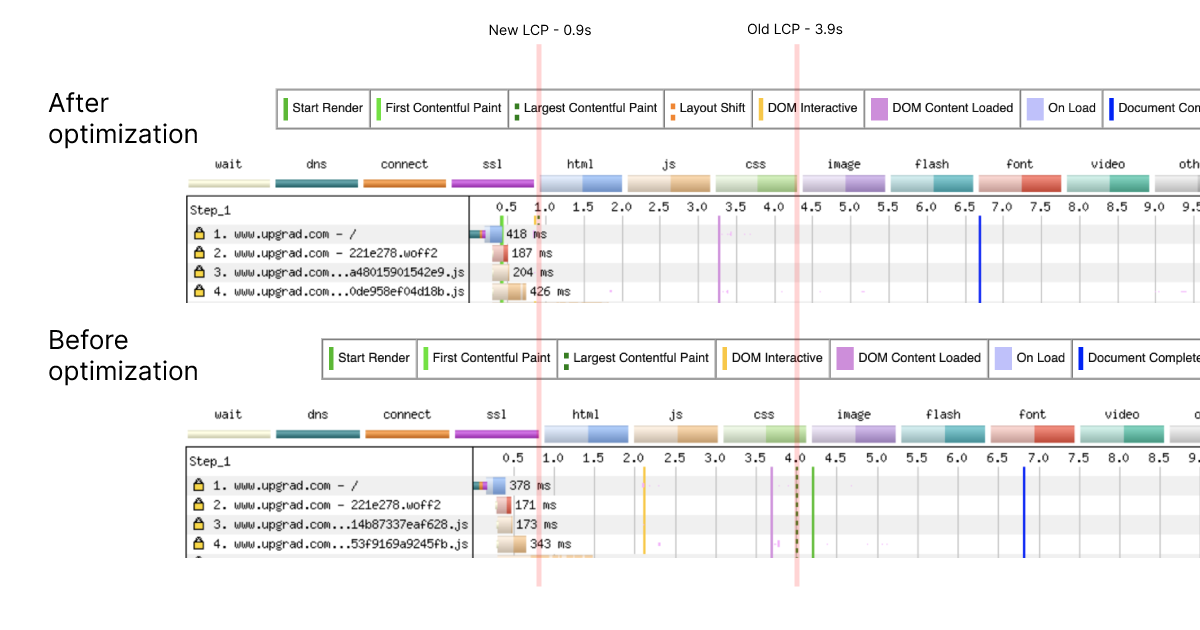
Applying these practices brought down our LCP largely - from 3.9 seconds to 0.9 seconds.
Google's web.dev sums up the above points in a very good way - it introduces the PRPL pattern.
- P - Push (or preload) the most important resources.
- R - Render the initial route as soon as possible.
- P - Pre-cache remaining assets.
- L - Lazy load other routes and non-critical assets.
Apart from pre-caching, I think I talked about the rest of the points. Pre-caching helps in improving the performance of the subsequent loads by caching assets that have a higher time-to-live.
Overall Improvements in upgrad.com's Performance #
Since the website runs on a server-side rendered Nuxt, it poses some special conditions to approach performance. Any SSR framework, accompanied with a CDN cache, guarantees a great TTFB and LCP, but suffers in time to interactivity as there's a re-hydration process that happens on the frontend.
A short description of how SSR works in Nuxt (from nuxtjs.org):
Server-side rendering (SSR), is the ability of an application to contribute by displaying the web-page on the server instead of rendering it in the browser. Server-side sends a fully rendered page to the client; the client's JavaScript bundle takes over which then allows the Vue.js app to hydrate.
Considering this, we only targeted the rendering and preloading bit of the entire process. We have plans to move to complete static rendering in the future which should solve the problem of hydration.
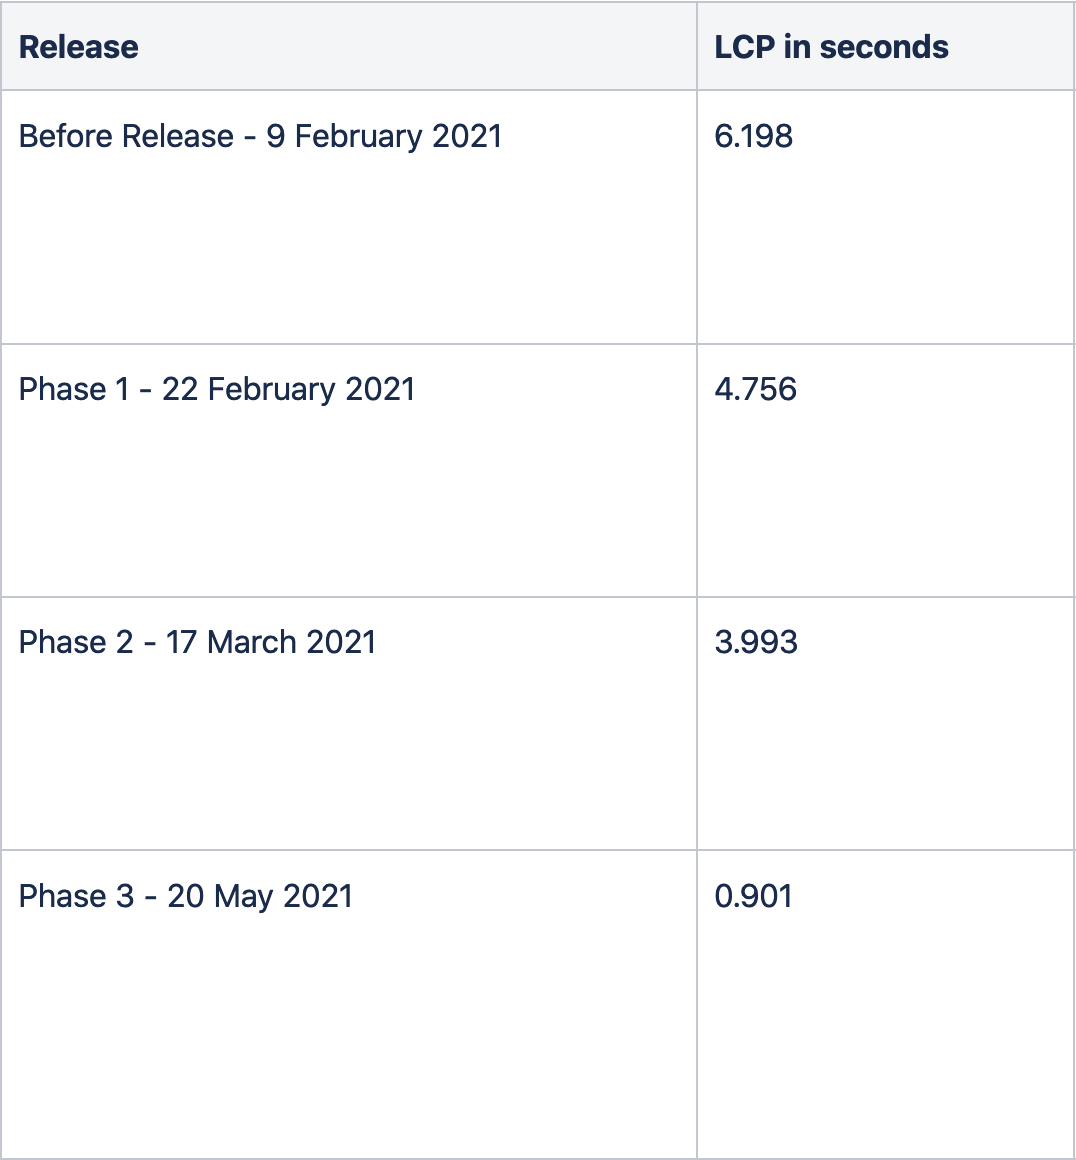
Anyway, we did this exercise over a period of 4 months, and occasionally worked on performance specific tasks. I believe most of the work in this field has to be slow and steady. There's a fair amount of trial and error, research and reading required when you begin. But consistent efforts towards improving and then maintaining performance do pay off well. This is how the LCP (in a desktop setup) improvement for us looked over time:
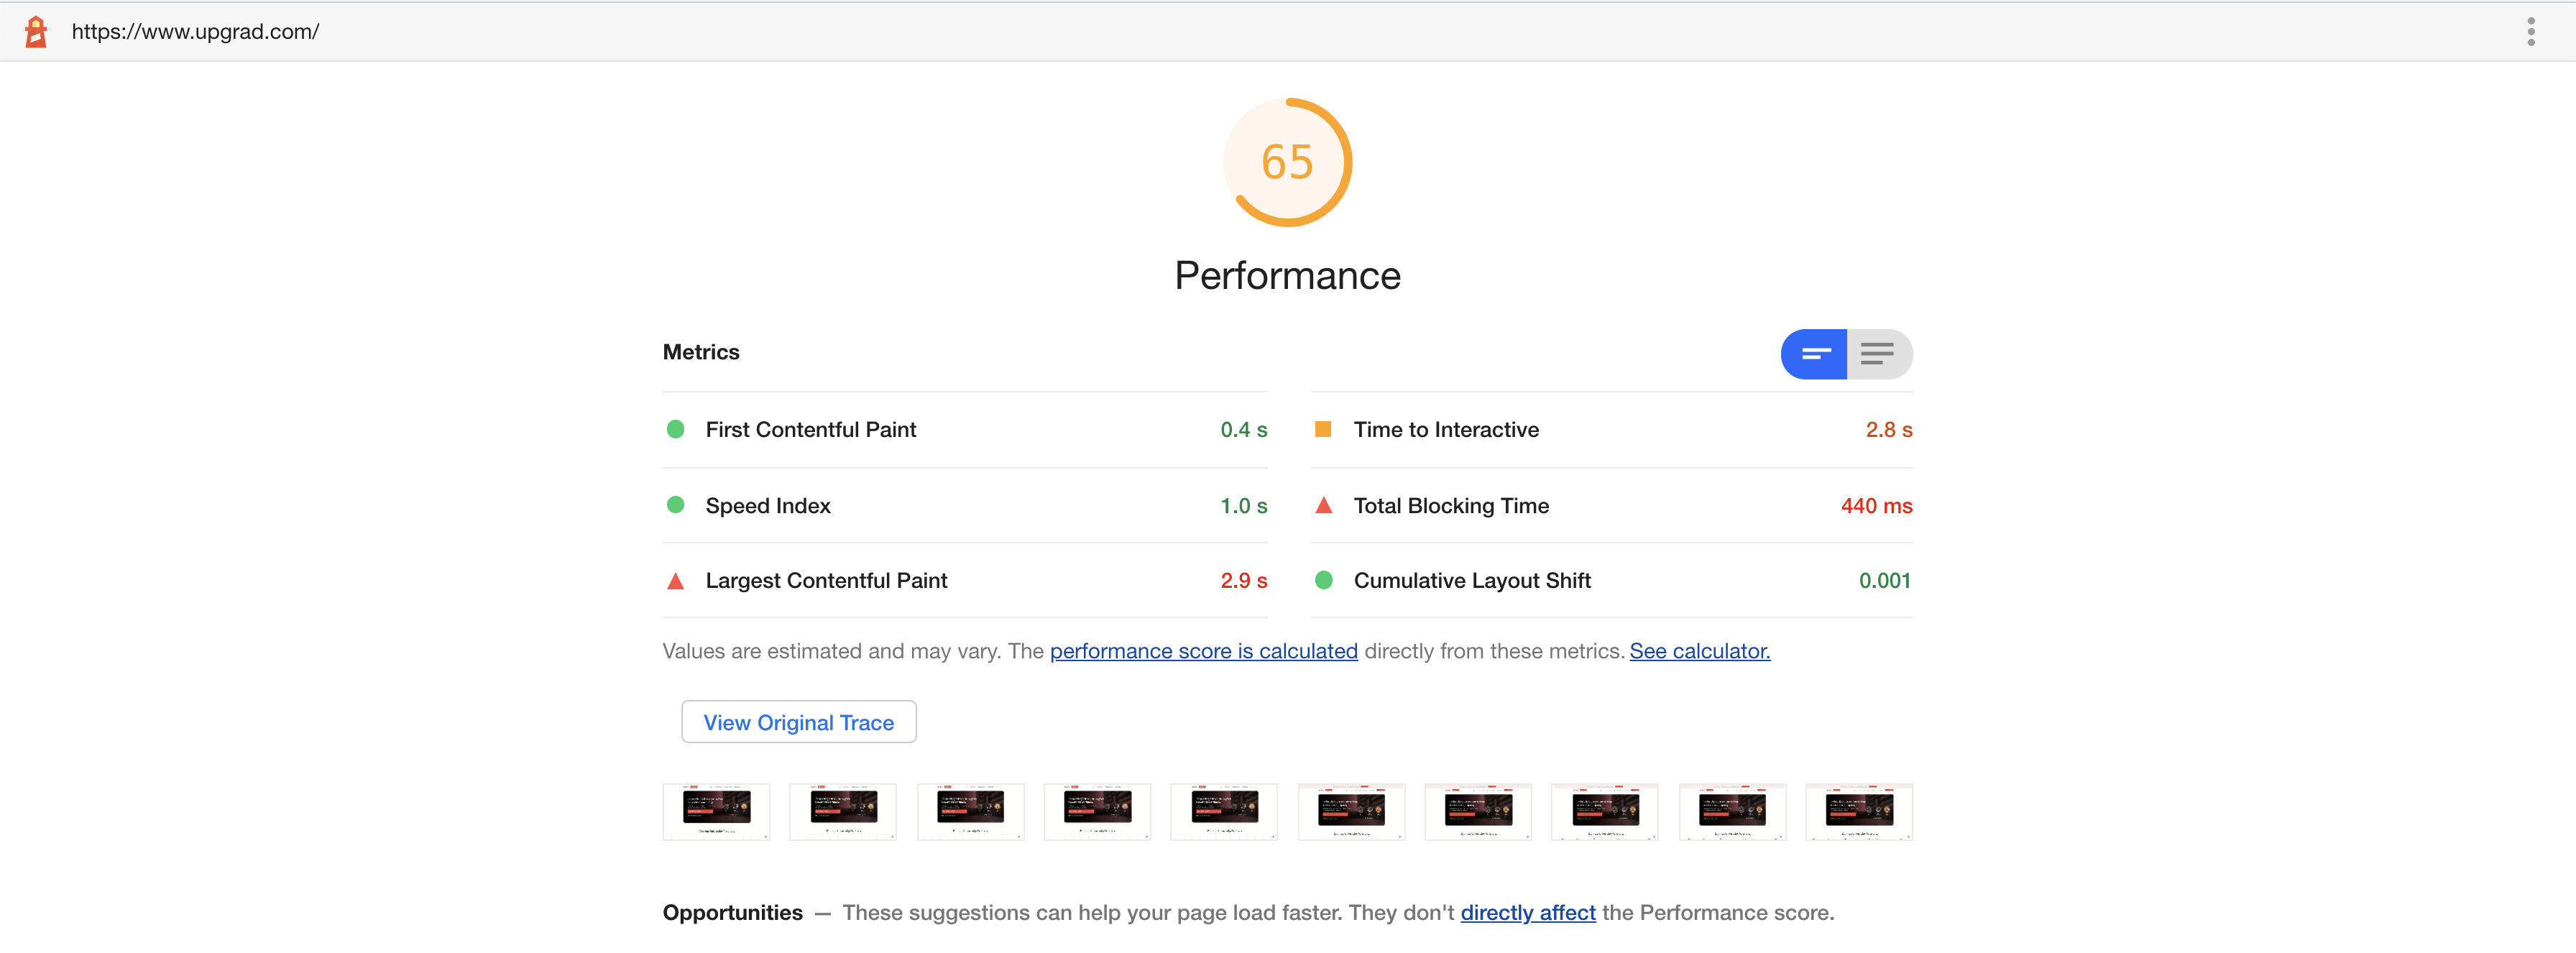
Our Lighthouse scores went up as well, as mentioned in the beginning of the article. Current score:
I have thoroughly enjoyed working on this and have learnt quite a lot about how pages get rendered and how to make them fast. We are targetting to a even better score as there is still a room for improvement, but honestly the current score is a good one to take a break and look back at it with a fresh mind. As next steps, this is what we are looking at:
- Performance Benchmarking - We've improved the scores, but it's our job now to maintain them there. Continuous monitoring is a crucial part of maintaining performance. There are tools available out there, or you can easily make one on your own (I did that :P, will link it later).
- Performance-optimised components - We're looking towards replacing certain shared UI components with lighter-weight alternatives.
- Brotli Compression & Infra-level changes - Brotli is enabled but needs some improvement in terms of the implementation. Also, infra-wise we look to reduce the number of hops required before reaching our origin server.
This entire feat wouldn't have been possible without my cooperative team, my manager Maitrey and Rohan. Me, Rohan and Maitrey have had numerous meetings to discuss this and have always worked towards building a performant and efficient platform. Things have worked like magic! Also, kudos to product leaders - Rohit & Shahir, to look at this as a direct business impact (and constantly pinging us about the website being slow :D). And finally, thanks to engineering leaders Vishal and Puneet for constantly supporting this entire exercise.
I've already linked relevant resources as and when required, but for all others, here's a collated list:
-
https://www.smashingmagazine.com/2021/01/front-end-performance-2021-free-pdf-checklist/
-
https://www.smashingmagazine.com/2021/01/smashingmag-performance-case-study/
-
https://csswizardry.com/2020/01/performance-budgets-pragmatically/
Do you have any similar experience, or a suggestion? I'd love to discuss! You can reach out to me on email, or Twitter, or comment below.


