It is 3 in the afternoon on a Tuesday and you receive a paging alert while on call and it says your frontend application has an increased error rate and users cannot log into your platform. You acknowledge the alert and start investigating what's wrong, which usually looks like:
- Going to the alert and checking for any linked dashboards
- Checking the dashboard for any out of the normal signs, e.g. a spike, a drop, a miss
- If you are a modern software engineering company, you have some form of observability with OpenTelemetry. So you look at spans and traces.
- You identify a certain upstream backend service that is called by your frontend that has a latency degradation starting 2:55 PM and it has stayed that way since.
- Before paging the team you do a quick check if the service was recently deployed - and yes! It was deployed at 2:54 PM, a minute before the latency degradation and a few minutes before you were paged.
- You either page the team owning the service, or if you are small team, you go and revert the previous deployment for this service.
- And the latency degradation stops, your frontend service errors drop to 0 and users can log in as usual, phew 😮💨
I am very sure a lot of us empathise with this story. If you have been on call, or have managed deployed services in any capacity, a majority of incidents are caused by a change introduced somewhere in the system. It is either a change in your own service, a change in an upstream dependency or a change in a 3rd party service.
Changes are the largest contributor to incidents because they inherently are capable of disturbing the equilibrium of a software system. This is a classic argument between a SRE/devops team and a product team at any organisation.
Product pushes for fast-paced development, crucial for business to stay relevant and on top of market development. SRE pushes for minimal change to production systems, also crucial for business to stay in business. The Google SRE book talks about this tension and how a middle-ground and the use of automation is crucial to keep shipping software feature fast and in a reliable way. In fact, DORA metrics mention:
DORA’s research has repeatedly demonstrated that speed and stability are not tradeoffs. In fact, we see that the metrics are correlated for most teams. Top performers do well across all five metrics, and low performers do poorly.
Change is an inherent part of software systems.
Today's observability picture - change is an afterthought #
We are deep into observability in 2025 and OpenTelemetry is the standard for observability. There were a few key themes in 2025 and going into 2026 about what observability should look like. Some of them that interest me, especially in context of this post (sources linked below ^1, ^2):
- Cost management for observability
- Increasing push to show business impact
- More AI-Driven Intelligence
There is big push for reviewing observability's humongous costs, we've all seen those threads where people complain how their observability bills have grown bigger than their operational costs. Additionally, there is a push for proving business impact of observability and making sense of the enormous amount of data (using AI, other means).
This lead me to think that today we have come to a point where we collect so much data and then apply solutions to make it meaningful or investigate issues and find impact. Why not approach this in the opposite way? Why not collect data only when it's most important?
Well there are reasons to collect as much data as possible, especially when you are a big software shop with hundreds of teams and thousands of services talking to each other. If you are not, you'd probably be interested in what I'm proposing here.
Change observability #
What if we collect information about how the software is changing instead of collecting everything that is happening with it? After all change is the largest contributor to software incidents and if we can solve this, we probably can solve the problems with observability.
Change can happen in a lot of different ways in a system, but the most common and easiest to detect is a code change, a.k.a. a deployment. A friend of mine and I have been thinking about this problem, having faced it in different forms in our time building small to big software systems. We started building a solution that lets you capture change information, starting with deployments and we call it Watchly.
It does a simple thing very well - it captures when and what has been deployed in your systems and provides a single view into what has changed for the user. Capturing deployments across various services is the first step to achieving true change observability.
The incident response flow in this case changes, and simplifies what to look in the crucial time between getting the page and resolving the issue. You receive a page, then:
- You go to Watchly, check when the system state changed last for the user
- If the time of a change corresponds to the alert time, investigate what service caused it, revert that service.
- If it does not correspond to a change, the issue is probably related to degradation over time or something external to your system. Check spans and metrics.
If you bridge the gap for the most significant contributor to software incidents while investigating an issue, you reduce the time to resolve the issue significantly! Collecting data about changes happening to your system in addition to collecting observability data can lead to nice improvements!
Argument for/against change detection in observability platforms #
Several platforms today provide an inference feature where you can highlight a time period and with all the data, the platform can suggest what may have led to the issue. This is nice, but I have rarely seen this work successfully in practice. This is an example of what I mean when I say change is an afterthought. I would rather capture change directly where it occurs instead of deriving it from other data.
But if this works for you, that's great! It is important that you use this feature in your response workflow!
What change observability promises #
Once you commit to observing changes, you can do a lot of amazing things with this data! When you can see how different services in your system deploy changes, you can create a picture of reliability from the user perspective. Instead of monitoring services individually, you can group multiple ones to denote a "group" and see how things change for the user when one of them deploys new code.
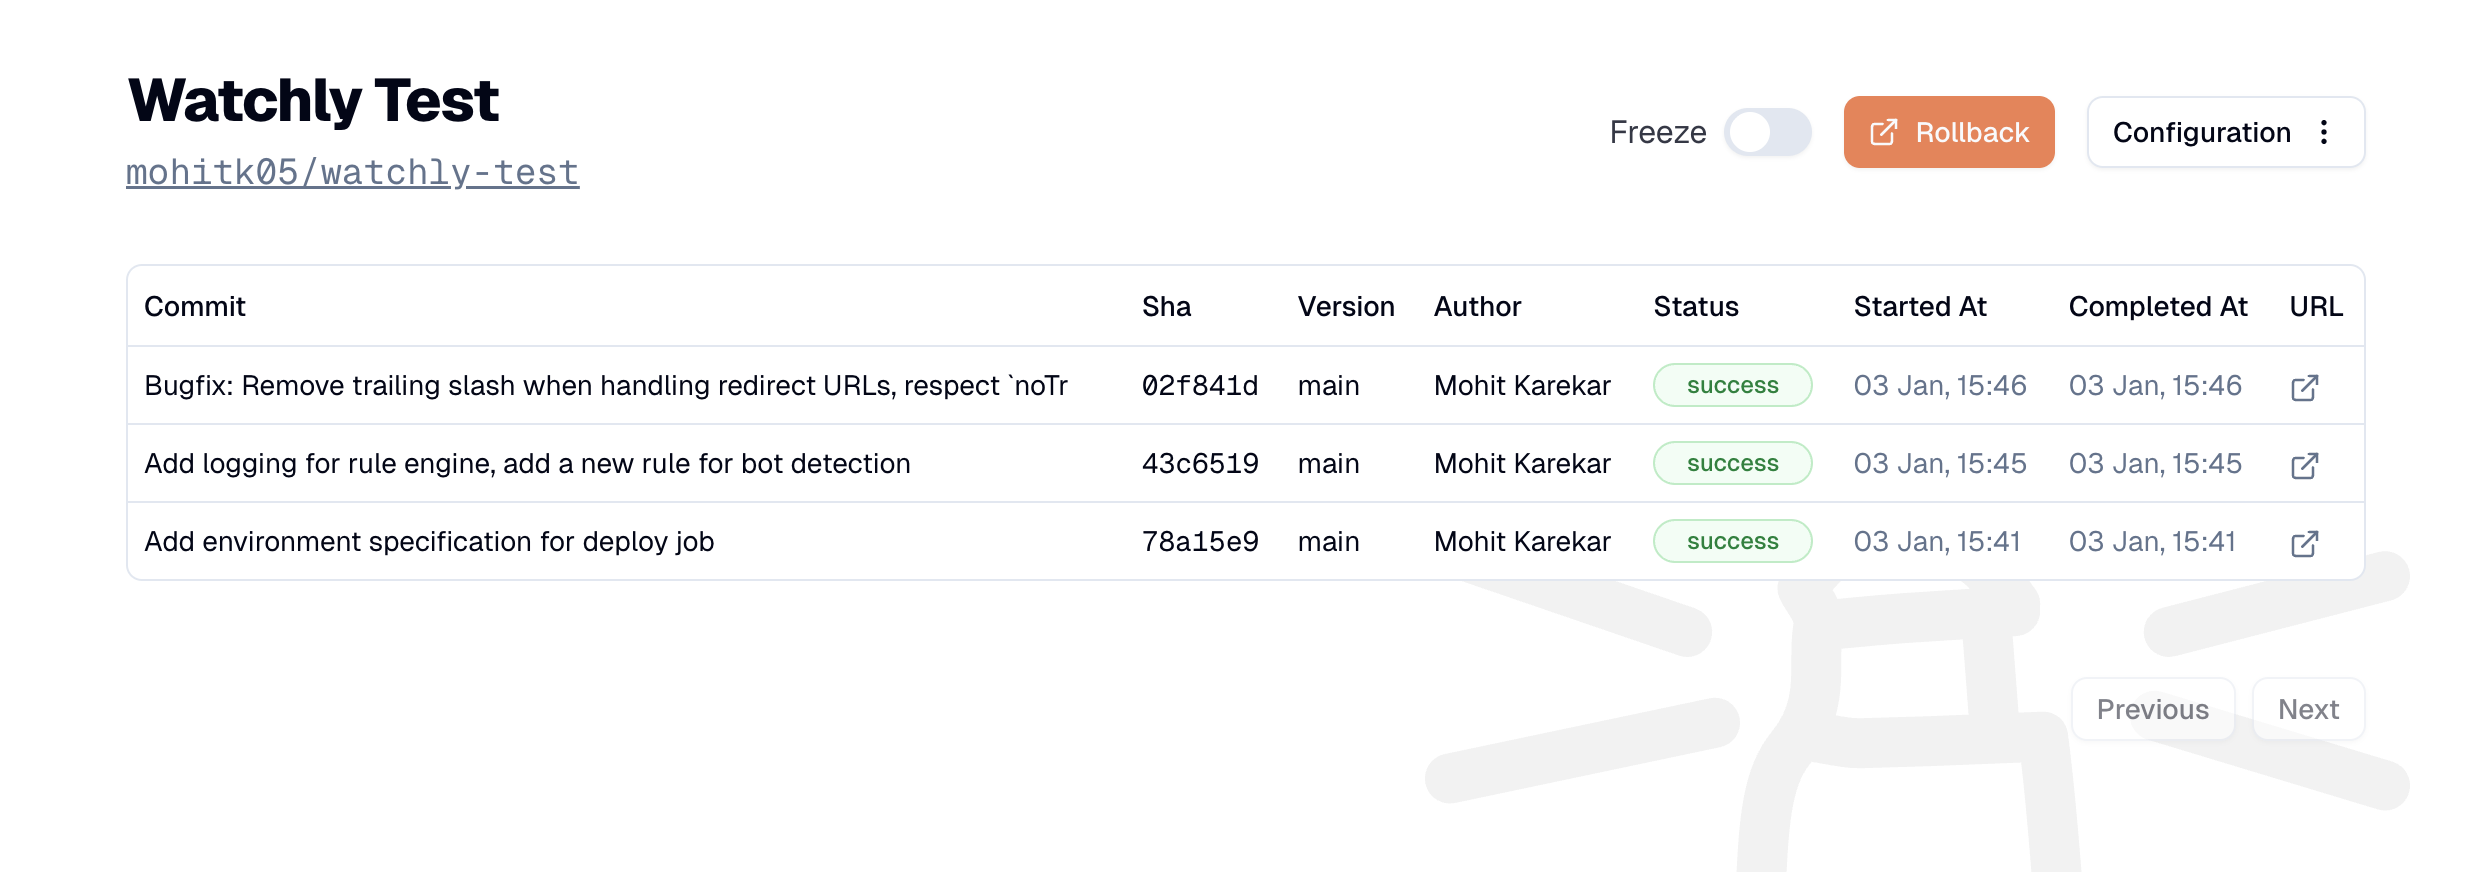
With Watchly, right now you can monitor individual "projects" which usually are independent code repositories but we plan to introduce the concept of a set of services to have a holistic view of your system. The current project view in Watchly is a simple list of deployments that happened in a service and the success rate. This already gives a good picture of what changed in the service.
Picking up from the usual incident response flow, we also added a feature to set a "rollback URL". This is the place you want to land at when you want to roll back a deployment. Additionally, we've also seen that automated deployments can lead to problems when an incident is in progress. You do not want to push something out when you know you have a problem, but believe me, we have done this in the past because our automation wasn't aware of the incident and just started deploying right during the incident!
You can ask Watchly to pause deployments. This will then not let your automated pipeline go through unless you explicitly resume deployments. In the future, we plan to provide a feature that automates this too.
Changes other than deployments #
Once you build tooling around capturing and reasoning about changes (like Watchly), you can hook in other kinds of "changes" that happen in your system. Another significant way to introduce a change in your system is configuration. Think of feature flags, feature config, environment variables, experiments etc. - anything that can change a value without a code change and is used by your service to determine what logic to execute.
What if we apply the same argument as deployments to configuration? Observing changing configuration and feature flags can add another vector to your change observability. In the end, the state of your system becomes a combination of all change vectors at a certain point in time and capturing these changes can give you information about what led to an issue very quickly.
State of the system = fn(state(config), state(code))
My argument is that observing changes in a system can give us improved observability into what broke the system. It may solve the shortcomings of the current state of observability:
- Costs: Capturing only change events may reduce the cost. I do not suggest replacing your observability solutions with such an implementation, but capturing most significant information can be valuable.
- Business impact: Capturing changes has direct business impact because you are essentially watching how things are changing for your end users. It has a potential to reduce the investigation time and increase the value of the data you collect.
- Reasoning about the collected data: While you can employ AI agents to make sense of the telemetry data you've collected, reasoning about what changed can be made simpler if you opt for change observability.
If you have resonated with my thoughts here, give Watchly a try - it's free for personal use up to 5 projects. We also have a team plan if you wish to use this at your work, reach out in case you want to discuss more. In any case, I would be happy to chat about change observability, SRE, monitoring or anything else - hit me up!


