I recently used a bit of statistics at work and I felt so empowered! I always knew about the domain, but given the kind of work I did (web, JavaScript), it did not involve a lot of applied statistics. Recently, I'm working a lot around site reliability engineering at Zalando - performance testing and reliability of systems during high load events, and what I realised is SRE has tons of statistics!
Statistics comes in very handy when you want to make sense of something that isn't clear in general sense. Usually, for several things in engineering, you'd have patterns and relations that are clearly known. E.g. complexity of algorithms. For commonly-used algorithms, you'd know the relationship between the number of nested for loops and the performance of your code. Another example is a system with only 2 components: a client and a server. You know that if the server takes longer to process a request, the experience on the client is going to be slow.
But when multiple systems come into picture, the pattern starts getting hazy and probably random if looked from the outside. Consider a large micro-service ecosystem with thousands of services talking to each other in synchronous and asynchronous ways. The impact of a service's latency on the end user cannot always be reasoned properly. Statistics is a great tool in such cases, when there are a lot of variables and not a clear relationship equation. Given you have a large amount of historical data about how the services have behaved, you can derive meaning out of the randomness.
Example 1 - Determining Throughput #
At Zalando, we run large load tests to prepare systems for high traffic events like Cyber Week, a time when the shop has great deals and campaigns that attract a large amount of shoppers in a short duration of time. Before each load test, teams owning upstream services prepare their systems to handle the load and perform calculations to determine expected scaling and resource metrics so that they can monitor their systems during the test.
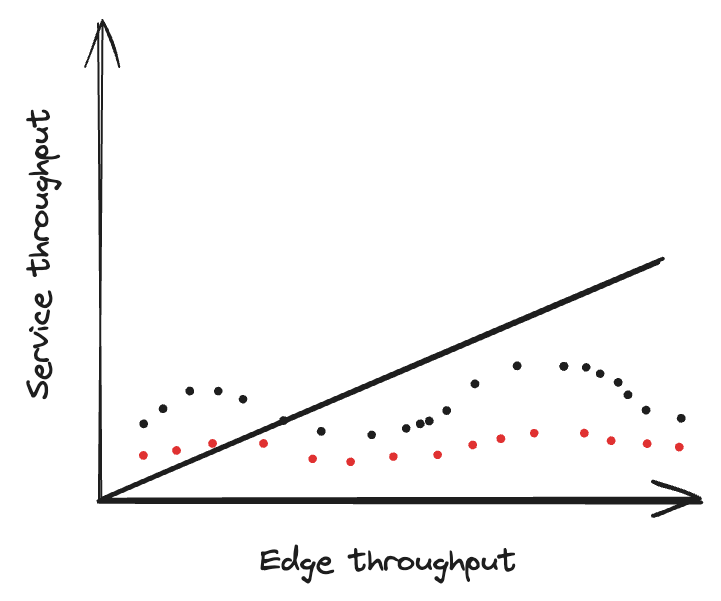
To perform these calculations they need to know an approximate throughput value for their service that would be applied during the load test. A straightforward approach could be using a multiplier factor, e.g. if the load test targets 2x normal traffic on a reference day, I (a service owner) can multiple the traffic I received on the reference date by 2. This might work for simple setups, but for larger, more complex service networks this is an oversimplification. Usually as requests flow through services they can get multiplied, optionally returned early or follow an asynchronous path to reach my service. Unfortunately just multiplying does not work here.
A simple solution here is to use an estimation model, e.g. linear regression (LR). LR tries to determine a relationship between a dependent variable and one or more independent variables when provided with sufficient data points. For the use case of throughput, the dependent variable is the throughput at a particular service (we want to calculate this) and one of the independent variables here can be the edge throughput. By creating a linear regression model, we can try to determine the relationship between the two by plotting a line which then can be used to calculate service throughput values for new edge throughput values.

simple-statistics is a tiny JavaScript library that helps you plot LR lines and use them to predict new values.
Example 2 - Detecting drops (anomalies) #
This one was an interesting problem to solve. We built a load testing capability internally at Zalando using open source Grafana k6 (an amazing load testing tool), hosted it in Kubernetes internally and enabled distributed load generation along with more features like finer control over manual ramping of virtual users, small framework layer over k6's JavaScript API to cater some org-specific needs and more.
We conduct large-scale end-to-end user journey load tests in preparation for Cyber Week, which is a high-sale event at Zalando. During these tests, we frequently had to shunt some traffic on the target system level because a particular service had received sufficient traffic but others needed more. In such cases, service owners would add shunt filters on their ingresses, powered by Skipper. Shunts, in general, are a great way to stop traffic to your service if you feel you are overwhelmed, or if an attacker is bombarding you with requests.
My electrical engineering degree reminds me of the concept of a shunt. It is a device with low resistance that is placed in parallel to the main device/network and in case of overcurrent, the shunt allows an easier path for it flow and hence protecting the main device.
Shunting an endpoint at times would lead to a sudden drop in end-to-end latency, and a load test tool being a dumb while-loop after all, it may start executing faster than before - meaning rest of the endpoints in the script now get called more frequently. We faced such situations a few times where when a shut was applied, a sudden spike of requests was observed to the target system. This was an undesired behaviour and put the target system and customer experience stability at risk - the load test tool is a double-edged sword.
We decided to write a protection mechanism, the idea was simple: if we see a sudden drop in the total duration of a single iteration of the script, we will inject synthetic latency (by adding a dynamic sleep() call) to keep the overall rate constant. This would ensure that the rate of requests being sent from k6 remains constant even when the virtual user can potentially generate more. We do lose some computation power, but the target system does not see a blitzkrieg of incoming requests. How do we detect a "drop" though? Well, statistics had the answer: exponentially weighted moving average (EWMA).
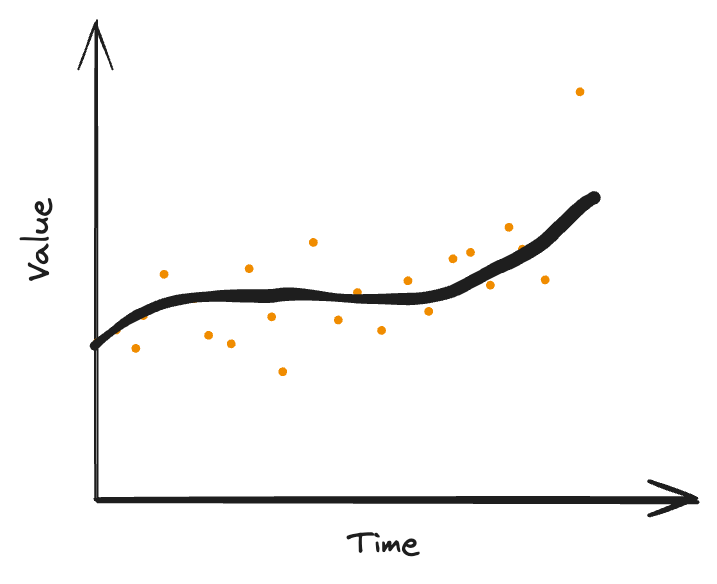
EWMA is a value for a time series which keeps track of a moving average where the importance of past values drops exponentially. It is widely used to smoothen a set of data points to a curve and in the financial domain to analyse volatility in market. The general equation of EWMA is as follows:

𝜆is the smoothing factor which tells how much weight should be given to new values in the time series.rtis the latest data point at timetEWMA(t-1)is the moving average value at timet - 1(previous)
The EWMA over time keeps track of the average of moving values and helps map a curve to the scattered points in the time series. The moving average values then can help us determine how the average value of the entity being measured moving over time. This eventually can be used to determine the range of "safe" values, and any values beyond this range would be anomalies.

Source: https://itl.nist.gov/div898/handbook/pmc/section3/pmc324.htm
EWMA Thresholds #
The moving average keeps track of the smoothened value which represents the past and the current data points. To identify anomalies, standard deviation (SD) can be put to use. A rule of thumb is if the EWMA value is beyond +/-3 * SD, then an anomaly has occurred. When a new data point is recorded, we can check the resultant EWMA value to determine if a breach has occurred. In code (Golang), it looks like follows:
type EWMA struct {
	lambda float64
	ewma   float64
}

func (e *EWMA) AddDatapoint(value float64) {
	e.ewma = e.lambda*value + (1-e.lambda)*e.ewma
}

func (e *EWMA) GetNewEWMA(value float64) float64 {
	return e.lambda*value + (1-e.lambda)*e.ewma
}

func (e *EWMA) GetEWMA() float64 {
	return e.ewma
}

func NewEWMA(lambda float64) *EWMA {
	return &EWMA{lambda: lambda, ewma: 0}
}

type EWMADropDetector struct {
	ewma              *EWMA
	count             int
	trainingPeriod    int
	sdThresholdFactor float64
	sdThresholds      []float64
}

func NewEWMADropDetector(ewma *EWMA, sdThresholdFactor float64, trainingPeriod int) *EWMADropDetector {
	return &EWMADropDetector{
		ewma: ewma, sdThresholds: []float64{0.0, 0.0}, count: 0, sdThresholdFactor: sdThresholdFactor, trainingPeriod: trainingPeriod,
	}
}

func (e *EWMADropDetector) AddDatapoint(value float64) bool {
	oldEWMA := e.ewma.ewma
	sd := math.Sqrt(e.ewma.ewma * e.ewma.lambda / (2 - e.ewma.lambda))

	e.ewma.AddDatapoint(value)
	e.count++

	if e.count < e.trainingPeriod {
		e.sdThresholds[0] = oldEWMA - e.sdThresholdFactor*sd
		e.sdThresholds[1] = oldEWMA + e.sdThresholdFactor*sd
		return false
	}

	return e.ewma.ewma < e.sdThresholds[0] || e.ewma.ewma > e.sdThresholds[1]
}
The AddDatapoint method accepts a new data point value and returns if the resultant EWMA breaches the defined thresholds in terms of standard deviation. It waits for the trainingPeriod to finish before reacting to new data points which ensures that the thresholds are stable.
In k6, this can either be implemented in the script (in JavaScript) or as a k6 extension in Go. We do this at bundle time using a ESBuild plugin which injects these lines at the start and end of a script function:
var __latencyDropThrottler = new ScenarioLatencyDropThrottler();

export default function() {
	const __iterStartTime = Date.now();
	// network calls
	__latencyDropThrottler.monitor(
		"scenario-name",
		Date.now() - __iterStartTime // total latency of the scenario (data point for EWMA)
	);
}
The latency throttling will happen on a virtual user level and the tool will now smoothen out any spikes or drops in latencies. It worked well for us in large load tests. As a next step, what we want to try is recovery, i.e. once the throttling kicks in, it stays there until the latency goes back to a value which is within thresholds. At times, the latency drop is desirable and we would want the model to gradually move to the recent latency value. This will help avoid the waste of CPUs cycles spent sleeping, essentially convert the sudden drop to a smooth curve if the latency stays at the same levels for a long time.
This sprinkle of statistics has heightened my interest in the field and am imagining more areas to use these models. I'm following this great talk by Heinrich Hartmann (Senior Principal SRE at Zalando) which goes over essentials of statistics every engineer should know.
Statistics for Engineers
I'm also collecting various anomaly detection models in a repository, if you are interested:
https://github.com/mohitk05/anomaly-detection


